- Topic1/3
4k Popularity
157k Popularity
13k Popularity
33k Popularity
100k Popularity
- Pin
- Hey Square fam! How many Alpha points have you racked up lately?
Did you get your airdrop? We’ve also got extra perks for you on Gate Square!
🎁 Show off your Alpha points gains, and you’ll get a shot at a $200U Mystery Box reward!
🥇 1 user with the highest points screenshot → $100U Mystery Box
✨ Top 5 sharers with quality posts → $20U Mystery Box each
📍【How to Join】
1️⃣ Make a post with the hashtag #ShowMyAlphaPoints#
2️⃣ Share a screenshot of your Alpha points, plus a one-liner: “I earned ____ with Gate Alpha. So worth it!”
👉 Bonus: Share your tips for earning points, redemption experienc
- 🎉 The #CandyDrop Futures Challenge is live — join now to share a 6 BTC prize pool!
📢 Post your futures trading experience on Gate Square with the event hashtag — $25 × 20 rewards are waiting!
🎁 $500 in futures trial vouchers up for grabs — 20 standout posts will win!
📅 Event Period: August 1, 2025, 15:00 – August 15, 2025, 19:00 (UTC+8)
👉 Event Link: https://www.gate.com/candy-drop/detail/BTC-98
Dare to trade. Dare to win.
Bitcoin price officially enters correction mode; Here’s what’s next
With Bitcoin (BTC) losing the $115,000 support amid a broader market correction, a trading expert has suggested that the asset has officially entered correction mode.
According to Master Ananda, Bitcoin’s corrective phase is evident in its nearly 10% decline from mid-July record highs, with the price now testing key support near the previous all-time high
Master AnandaIn an August 2 TradingView Analysis, Ananda noted that despite the current bearishness, Bitcoin remains within a healthy bullish cycle, characterized by recurring upward momentum followed by expected pullbacks.
TradingViewAnalysisAnanda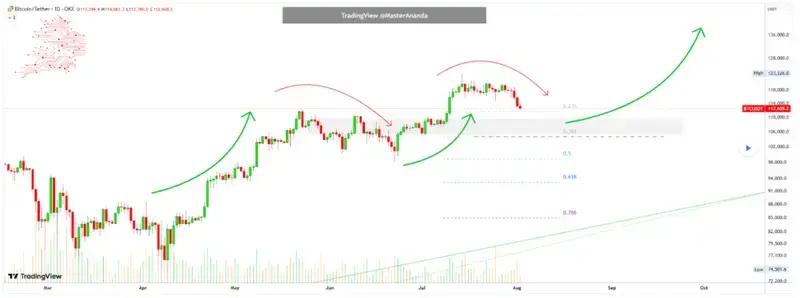 Bitcoin price analysis chart. Source: TradingView
![]() Bitcoin price analysis chart. Source: TradingView**Bitcoin price analysis chart. Source: TradingViewTherefore, the current correction appears to be part of a broader pattern of price fluctuations that historically set the stage for new highs. If past trends hold, this consolidation could pave the way for a renewed rally toward fresh all-time highs.
Bitcoin price analysis chart. Source: TradingView**Bitcoin price analysis chart. Source: TradingViewTherefore, the current correction appears to be part of a broader pattern of price fluctuations that historically set the stage for new highs. If past trends hold, this consolidation could pave the way for a renewed rally toward fresh all-time highs.
Key Bitcoin price levels to watch
The analyst highlighted strong support between $110,000 and $100,000, with $100,000 acting as a key technical and psychological level
Additional pullback zones are marked by Fibonacci retracement levels, with the 0.382 level around $106,000 and the 0.5 level near $102,000.
As long as Bitcoin stays above $100,000, the long-term bullish trend remains intact. A weekly or monthly close below that level would prompt a reassessment. Past cycles suggest a period of sideways consolidation before a renewed uptrend.
It’s worth noting that Bitcoin took a hit alongside the equities market as investors were rattled by disappointing July jobs data and uncertainty stemming from sweeping U.S. trade tariffs.
Meanwhile, according to another cryptocurrency analyst, Ali Martinez, in an August 2 X post, Bitcoin is finding strong support at $107,160, where over 111,000 BTC have been accumulated, based on Glassnode data.
This level marks the largest buy zone below the current price, reinforcing it as a critical floor. Martinez also noted that resistance is building at $117,400, where 88,000 BTC were purchased
$107,160 continues to emerge as a crucial support level for Bitcoin $BTC! pic.twitter.com/izOejLbagA
Bitcoin price analysis
At press time, Bitcoin was trading at $113,651, having posted a modest gain of less than 0.1% in the past 24 hours. On the weekly timeframe, however, the leading digital asset is down over 4%.
Featured image via Shutterstock.
***Featured image via Shutterstock.***Featured image via Shutterstock.